Quarterly Fundraising Report™

Year-to-Date Nonprofit Sector Trends
Q2 2025 (JAN 1, 2025 - JUN 30, 2025)

  • Donors: The number of people who have made a donation so far this year
  • Dollars: The amount of money raised by people making a donation so far this year
  • Retention: The percentage of people who have been retained from previous years so far this year

Key Insights


  • Nonprofits engaged and retained donors through Q2 2025 at roughly the same rate as the year prior, once late-data adjustments and the margin of error are factored in. The figures suggest a stabilizing trend, with the year-over-year (YOY) decline in donor numbers decelerating and possibly leveling off through Q2.
  • Despite the flat trend in donor engagement and minimal percentage point (p.p.) shift in retention, organizations experienced a 2.9% increase in the amount of dollars raised YOY, after factoring in late-arriving data.
  • Fundraising outcomes continue to depend heavily on large donors. Year-to-date performance among supersize donors has been softer than in 2024, though they remain a significant contributor at mid-year.

DONORS

-1.9%
(+/- 2.0%)
YOY change
DOLLARS

+2.9%
(+/- 2.0%)
YOY change
RETENTION

-0.1 p.p.
(+/- 0.14 p.p.)
YOY change
 
  • In this report, we compare data compiled from previous years to 2025. All metrics are computed up to Q2 (from January of a given year to the end of June of the same year).
  • As of Q1 2025, we have updated the way we calculate and report year-over-year changes in retention rates. An explanation of the changes can be found here.
Year-to-date Fundraising Performance. All rights reserved.
1


Current Dataset

Year-to-Date Nonprofit Sector Trends
Q2 2025 (JAN 1, 2025 - JUN 30, 2025)

Key Limitations


  • Data in our panel is limited to organizations with >=3 years of data, with $5K - $25M received in the prior year, via the Growth in Giving database.
  • We weight the data in our panel by organization fundraising size and NTEE (National Taxonomy of Exempt Entities) cause area to improve the representativeness of our findings.
  • A significant amount of data arrives late, so we estimate the difference for topline metrics by reviewing historical patterns of delayed data. Throughout this report, ranges for each metric express uncertainty in the estimates. However, the subsequent splits (such as donors by donor size) are not adjusted and therefore may not reflect the macro trends seen in the topline figures reported on page 1.

DONORS

4.0M
in 2025
DOLLARS

$5.3B
in 2025
ORGANIZATIONS

15,054
in 2025
 
  • Revenue and retention metrics report on year-to-date (YTD) performance compared against the prior year total, based on a panel of organizations selected from the Growth in Giving Database of 400 million transactions from more than 38,000 organizations since 2005.
Year-to-date Fundraising Performance. All rights reserved.
2


Donors: Time Series

Year-to-Date Nonprofit Sector Trends
Q2 2025 (JAN 1, 2025 - JUN 30, 2025)

  • Overall rate of growth in donors: net of gains minus losses in number of donors from last year to this year divided by total number of donors up to this time last year.

Key Insights


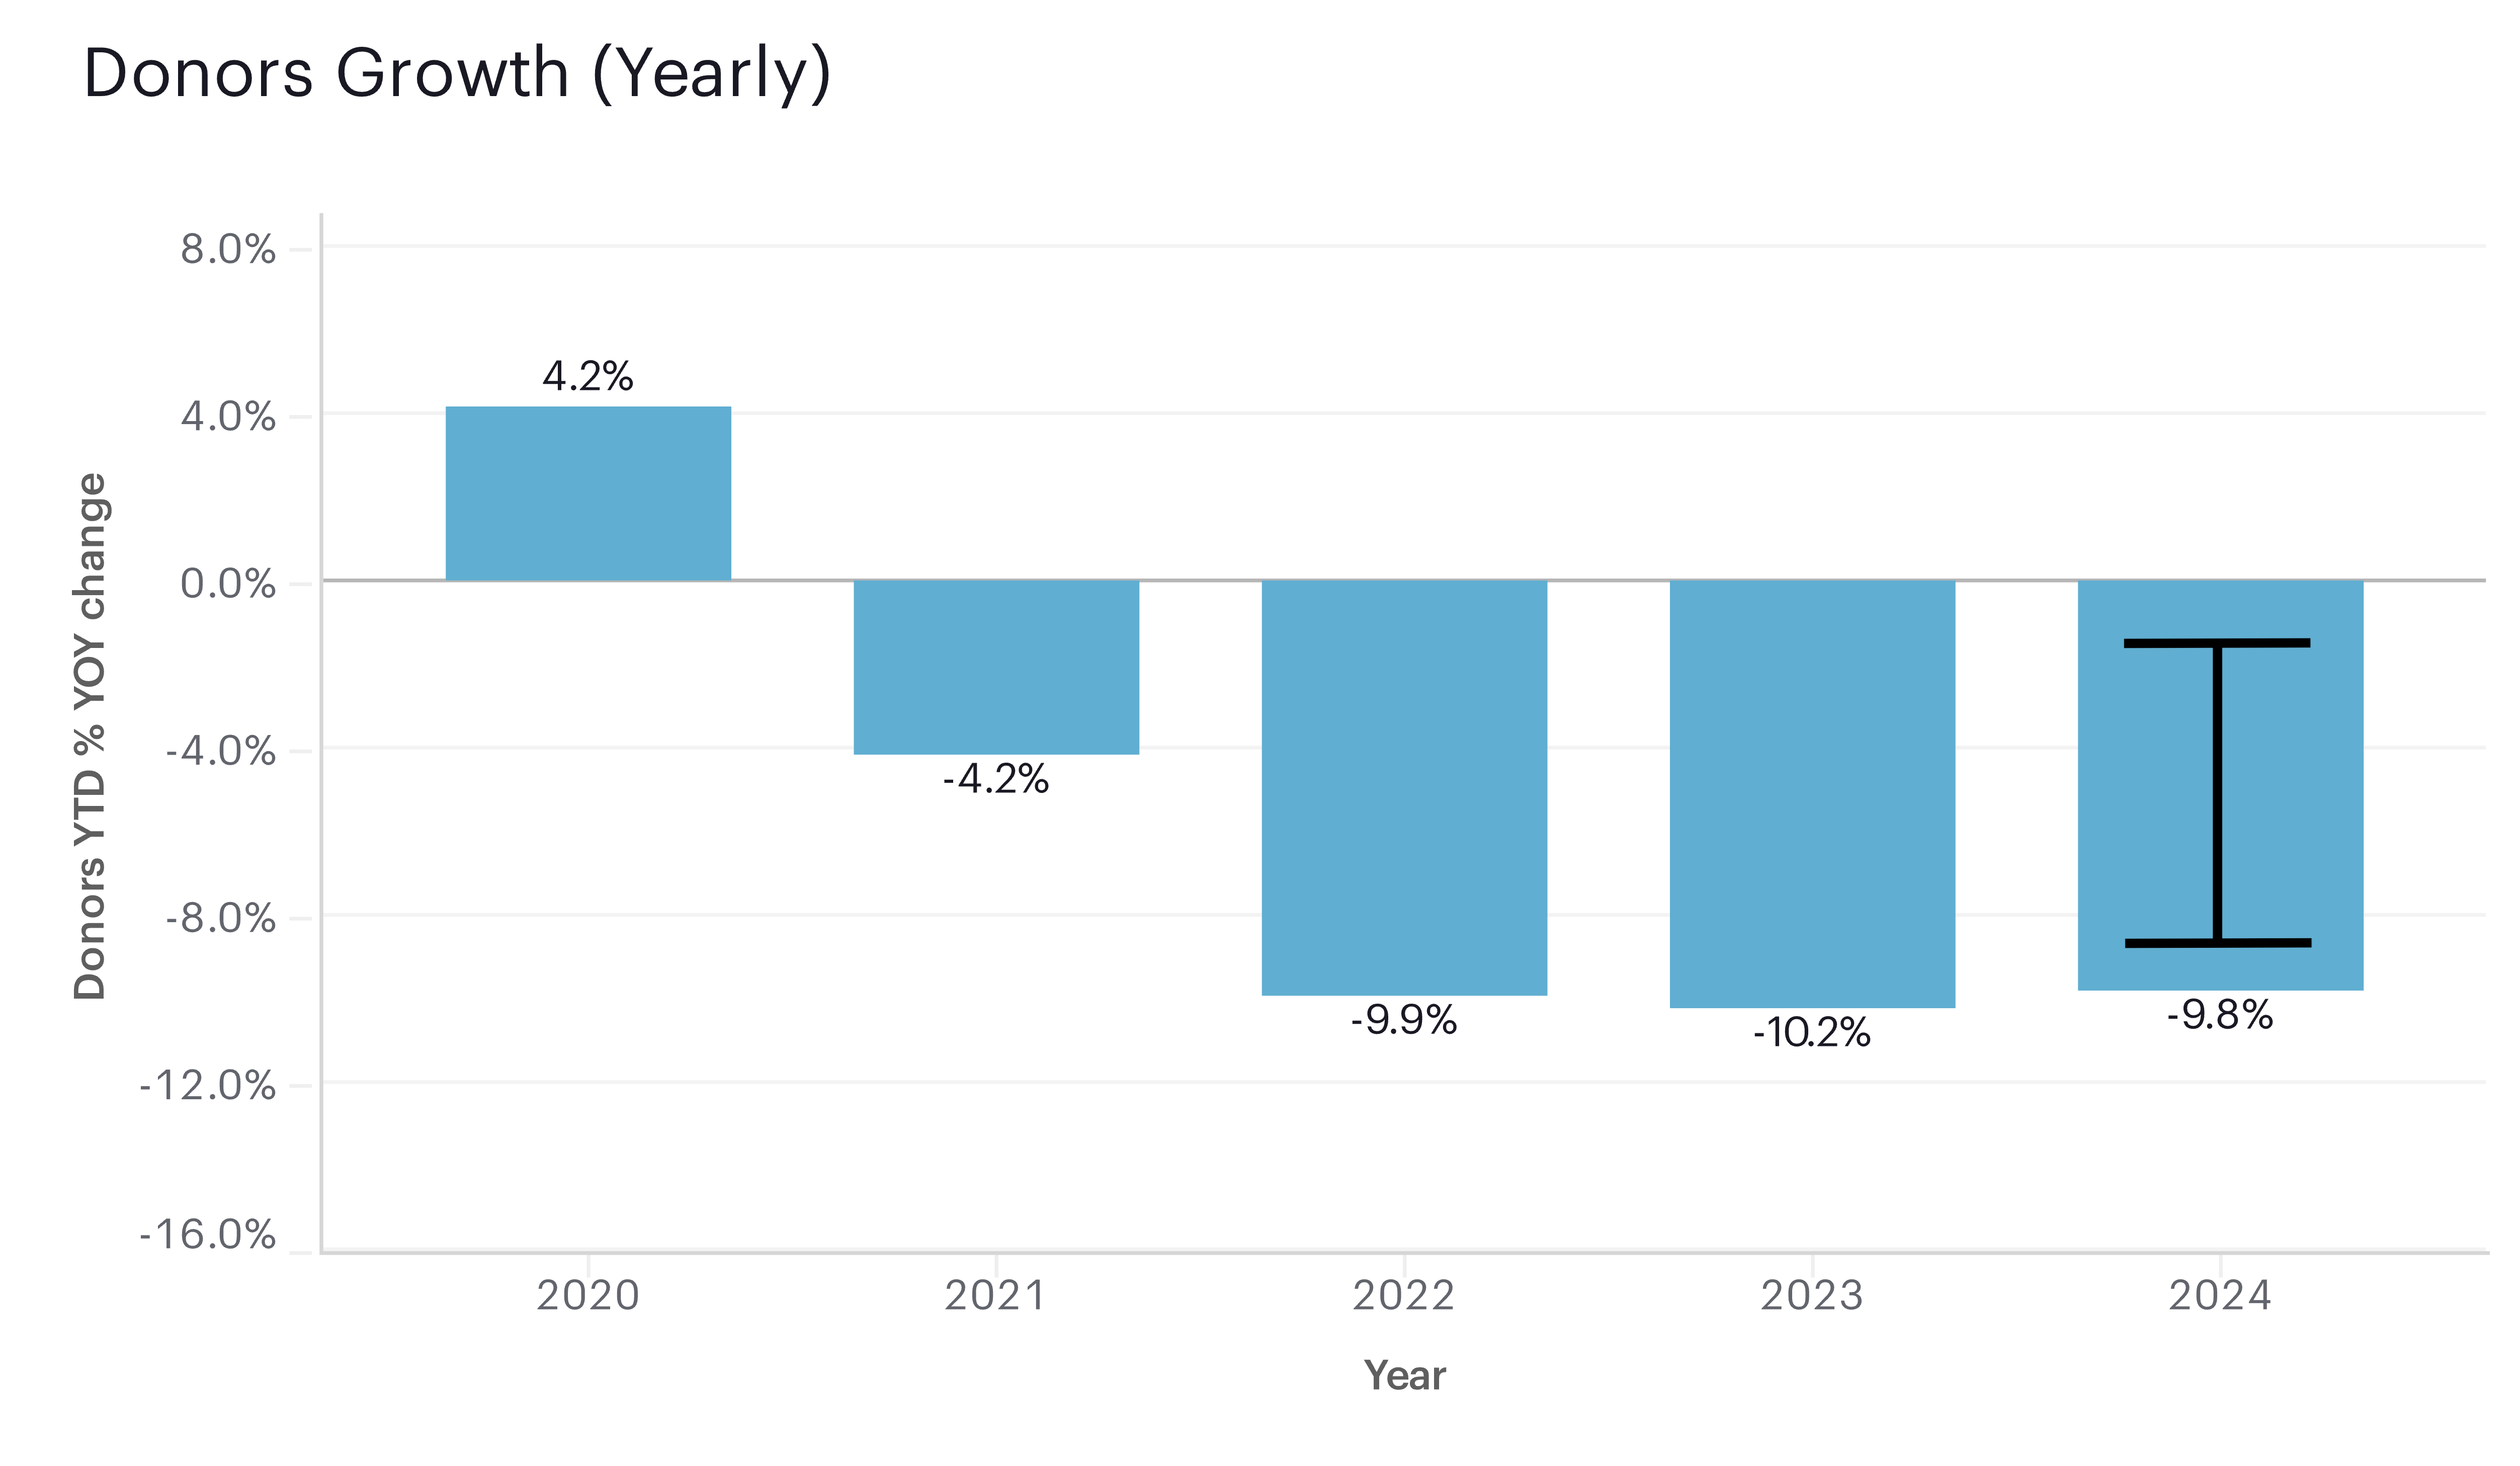
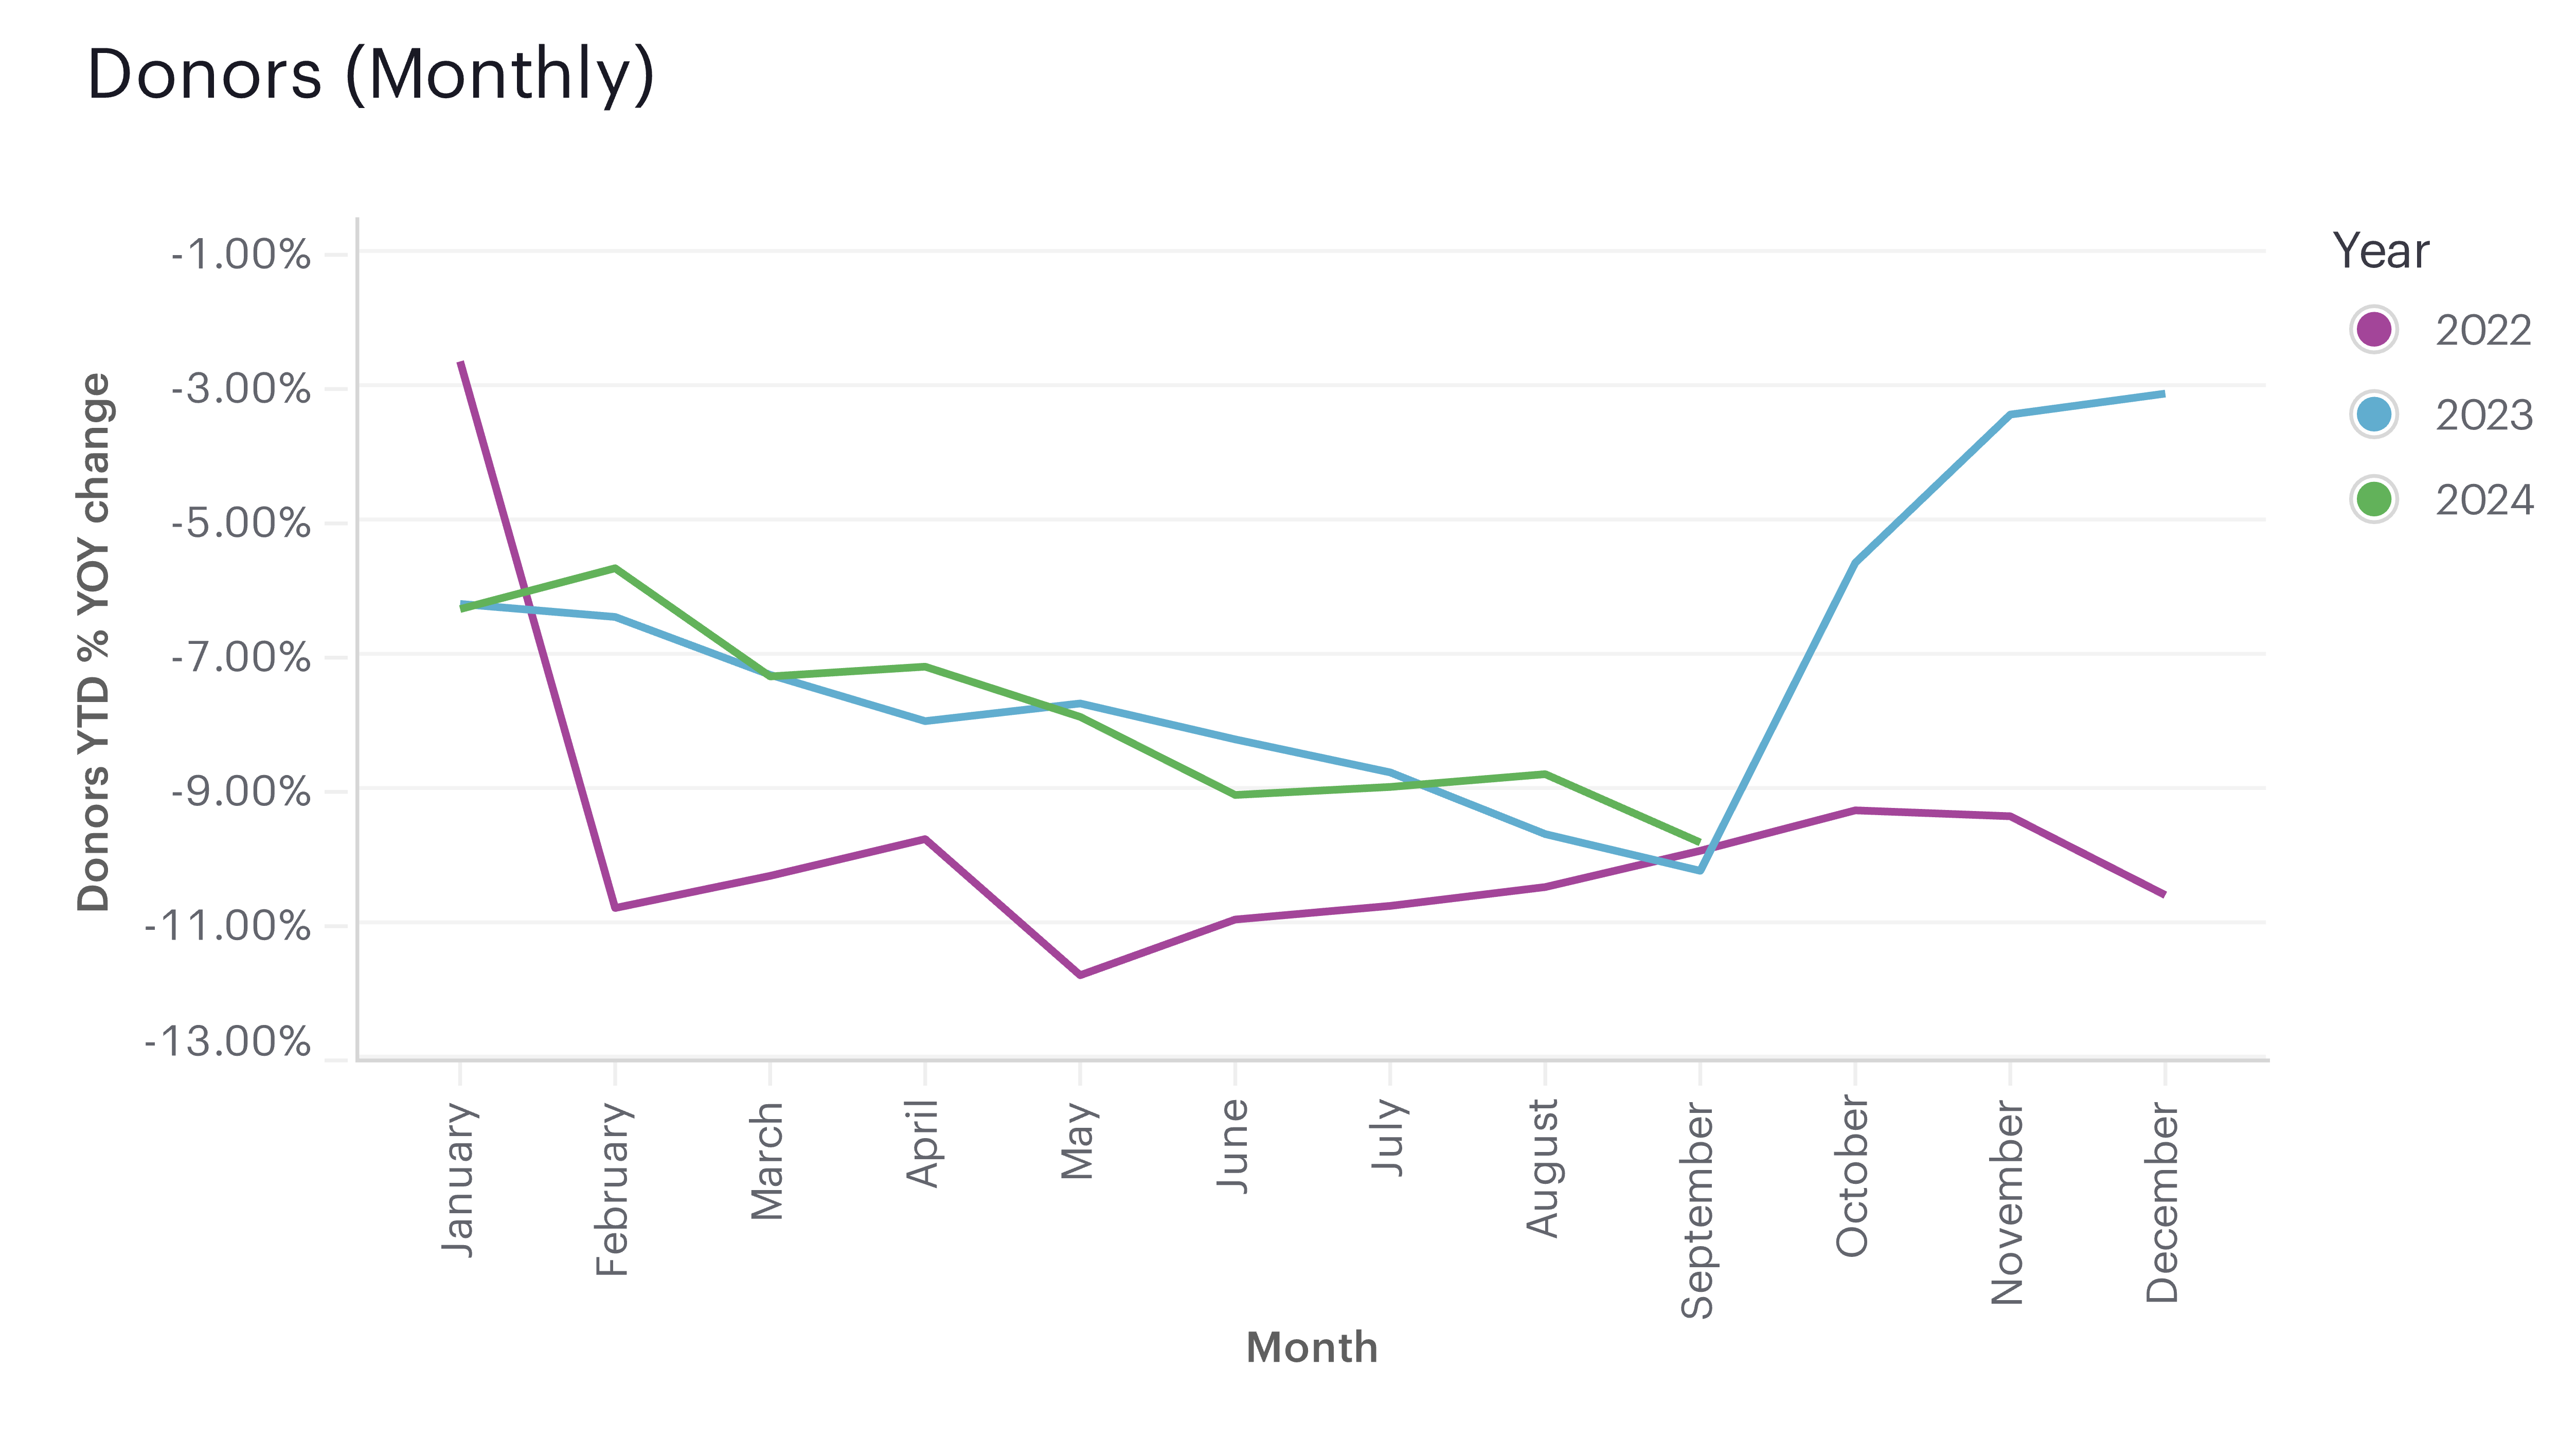
  • We estimate that the number of donors decreased by 1.9% (±2.0%) YOY through Q2 2025, after adjusting for late-arriving data.
  • Given the margin of error, the true change could range from a slight increase to a modest decline, suggesting the decline in donor participation may be leveling off.


  • The trend from the past five years reinforces this slowing decline, with signs of a potential return to stability since the end of the pandemic.


NOTE: The panel for each year differs based on our panel rules (organizations with stable growth and $5K - $25M total transactions in each of the three previous years, via the Growth in Giving database). This means that the YOY comparisons on this page are comparing a different sample of organizations each year.
Year-to-date Fundraising Performance. All rights reserved.
3


Donors by Donor Size

Year-to-Date Nonprofit Sector Trends
Q2 2025 (JAN 1, 2025 - JUN 30, 2025)

  • Donor size: the grouping of donors by giving levels (dollar ranges) using donors’ year-to-date giving amounts

Key Insights


  • Micro donors ($1 - $100), who make up 51.9% of the donor base, show the biggest relative drop
    (-10.4% YOY, unadjusted for late data) in donor numbers, with the other size categories seeing more
    modest decreases.
  • These declines are less pronounced than the declines observed through Q2 2024, where small donors
    decreased by -12.3% (YOY, unadjusted).
  • The rate of decline in donor counts was smaller among larger donor groups, mirroring trends seen in
    past quarters.

MICRO
($1 - $100)

-10.4%
YOY Change
SMALL
($101 - $500)

-5.4%
YOY Change
MIDSIZE
($501 - $5K)

-4.4%
YOY Change
MAJOR
($5K - $50K)

-3.4%
YOY Change
SUPERSIZE
($50K+)

-4.5%
YOY Change

51.9%
% of total donors

30.9%
% of total donors

14.5%
% of total donors

2.3%
% of total donors

0.3%
% of total donors
 
All year-over-year (YOY) changes are computed on year-to-date (YTD) totals. Donor size segments were chosen to span both dollars and donors, with each segment representing 1-50% of the total. Estimates for late data only apply to top-line donors, dollars, and retention. Thus, these more granular breakdowns underestimate year-over-year growth.
Year-to-date Fundraising Performance. All rights reserved.
4


Donors by Life Cycle

Year-to-Date Nonprofit Sector Trends
Q2 2025 (JAN 1, 2025 - JUN 30, 2025)

  • Donor Life Cycle: the grouping of donors based on when they were last seen in the dataset

Key Insights


  • Our results suggest a weakening new donor acquisition and retention pipeline. Organizations are struggling both to bring in new supporters and to convert them into longer-term donors, limiting opportunities to build durable donor relationships.
  • Nonprofits continue to face challenges recruiting and retaining first-time donors. This segment saw the steepest decline in counts (-10.7% YOY, unadjusted for late data).
  • New-retained donors, those individuals who gave to an organization for the first time last year and returned this year, also declined sharply (-10.2% YOY, unadjusted). This decrease does not solely reflect weaker retention of last year’s new donors. It also reflects a smaller pool of new donors available to be retained, owing to weaker acquisition in the prior year.

NEW
DONORS
 

-10.7%
YOY Change
NEW RETAINED
DONORS
 

-10.2%
YOY Change
REPEAT
RETAINED
DONORS

-5.1%
YOY Change
RECAPTURED
DONORS
 

-7.9%
YOY Change

34.2%
% of total donors

9.1%
% of total donors

43.8%
% of total donors

12.9%
% of total donors
 
NEW DONORS - never gave to this organization before.
NEW RETAINED DONORS - gave last year to the organization, but never before.
REPEAT RETAINED DONORS - gave last year to the organization, but not for the first time.
RECAPTURED DONORS - did not give last year to the organization, but had given in the past.
Year-to-date Fundraising Performance. All rights reserved.
5


Donors by Donation Count

Year-to-Date Nonprofit Sector Trends
Q2 2025 (JAN 1, 2025 - JUN 30, 2025)

  • Donor Donation Counts: the grouping of donors based on how many times they've made a donation

Key Insights


  • One-time donors comprised over two-thirds of the total number of donors through Q2 2025. This group experienced the third largest decline (-7.9% YOY, unadjusted for late data) in donors relative to the same period in 2024. This fall in one-time donors accounted for over two-thirds of the total decline in donors for the first half of the year.
  • Donors who have contributed twice year-to-date experienced the largest decrease across all groups (-11.0% YOY, unadjusted). This segment comprises roughly one in ten donors.

1 DONATION

-7.9%
YOY Change
2 DONATIONS

-11.0%
YOY Change
3-6 DONATIONS

-5.4%
YOY Change
7+ DONATIONS

-9.5%
YOY Change

68.4%
% of total donors

10.9%
% of total donors

17.6%
% of total donors

3.1%
% of total donors
 
Donation count segments were selected to best illustrate the distribution of total donors and dollars across the giving spectrum. A donor's donation count includes all donations made year-to-date.
Year-to-date Fundraising Performance. All rights reserved.
6


Dollars: Time Series

Year-to-Date Nonprofit Sector Trends
Q2 2025 (JAN 1, 2025 - JUN 30, 2025)

  • Overall rate of growth in dollars: net of gains minus losses in money from fundraising from last year to this year divided by total dollars raised up to this time last year

Key Insights


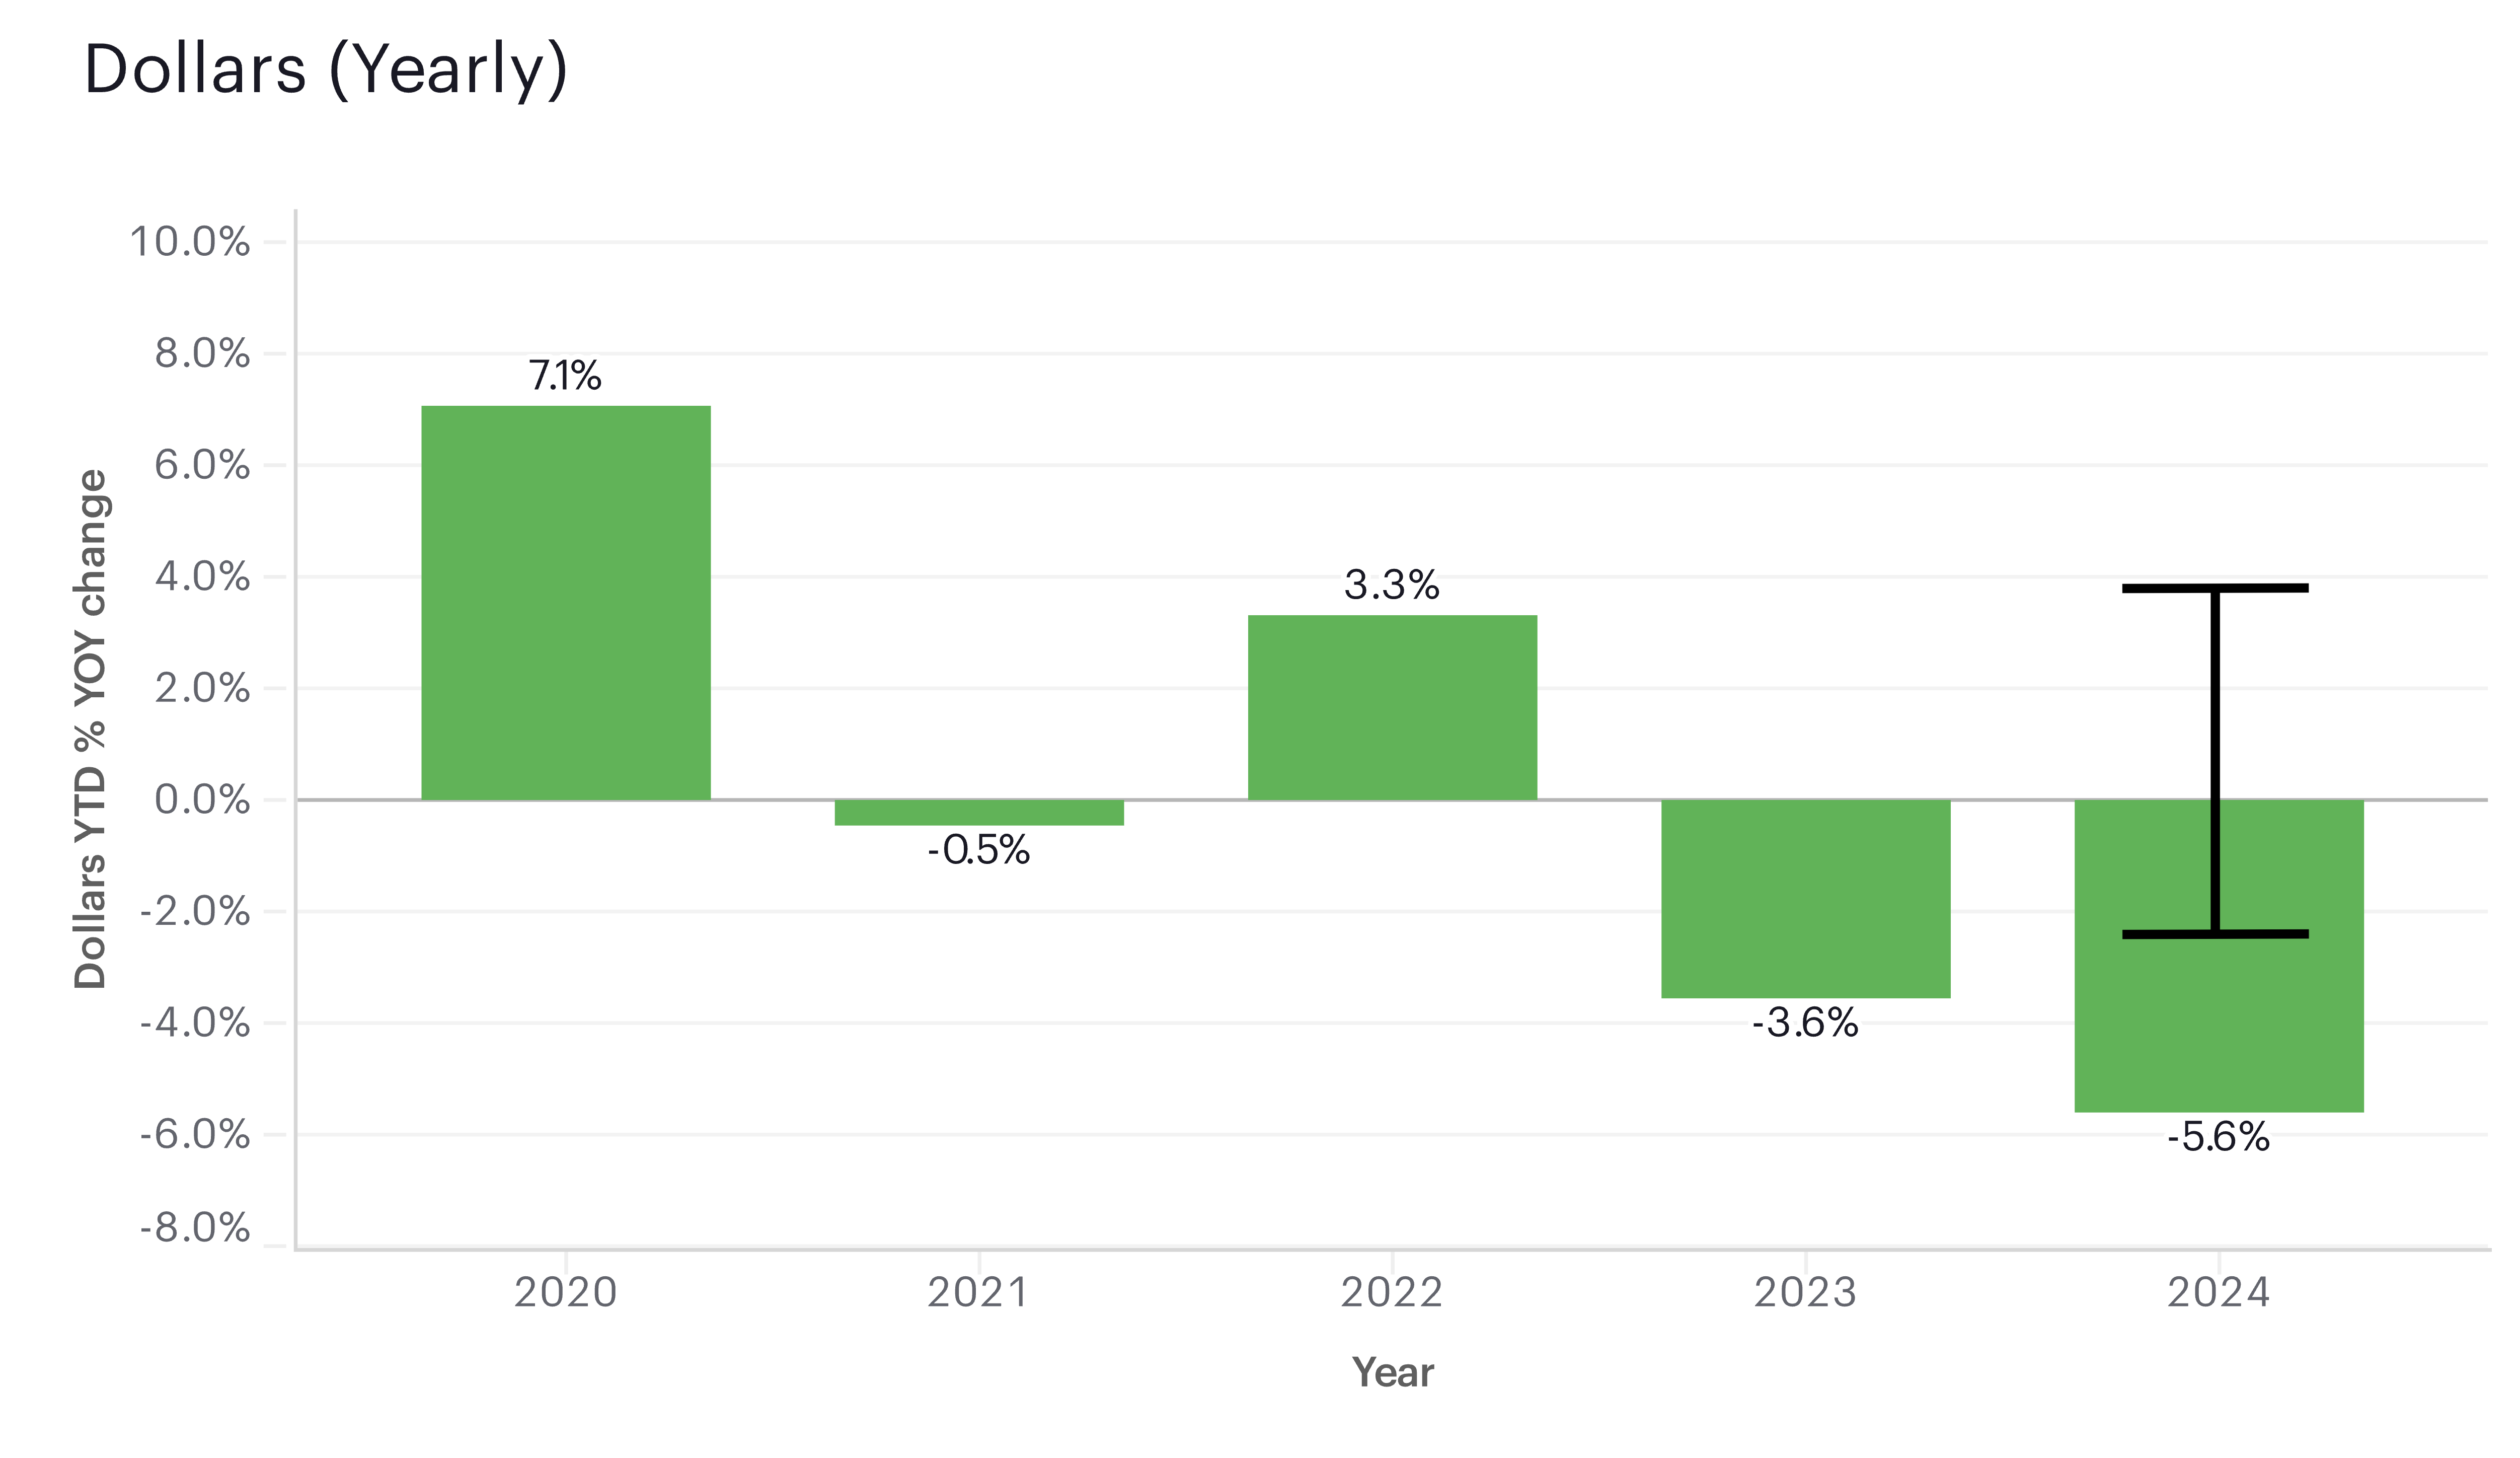
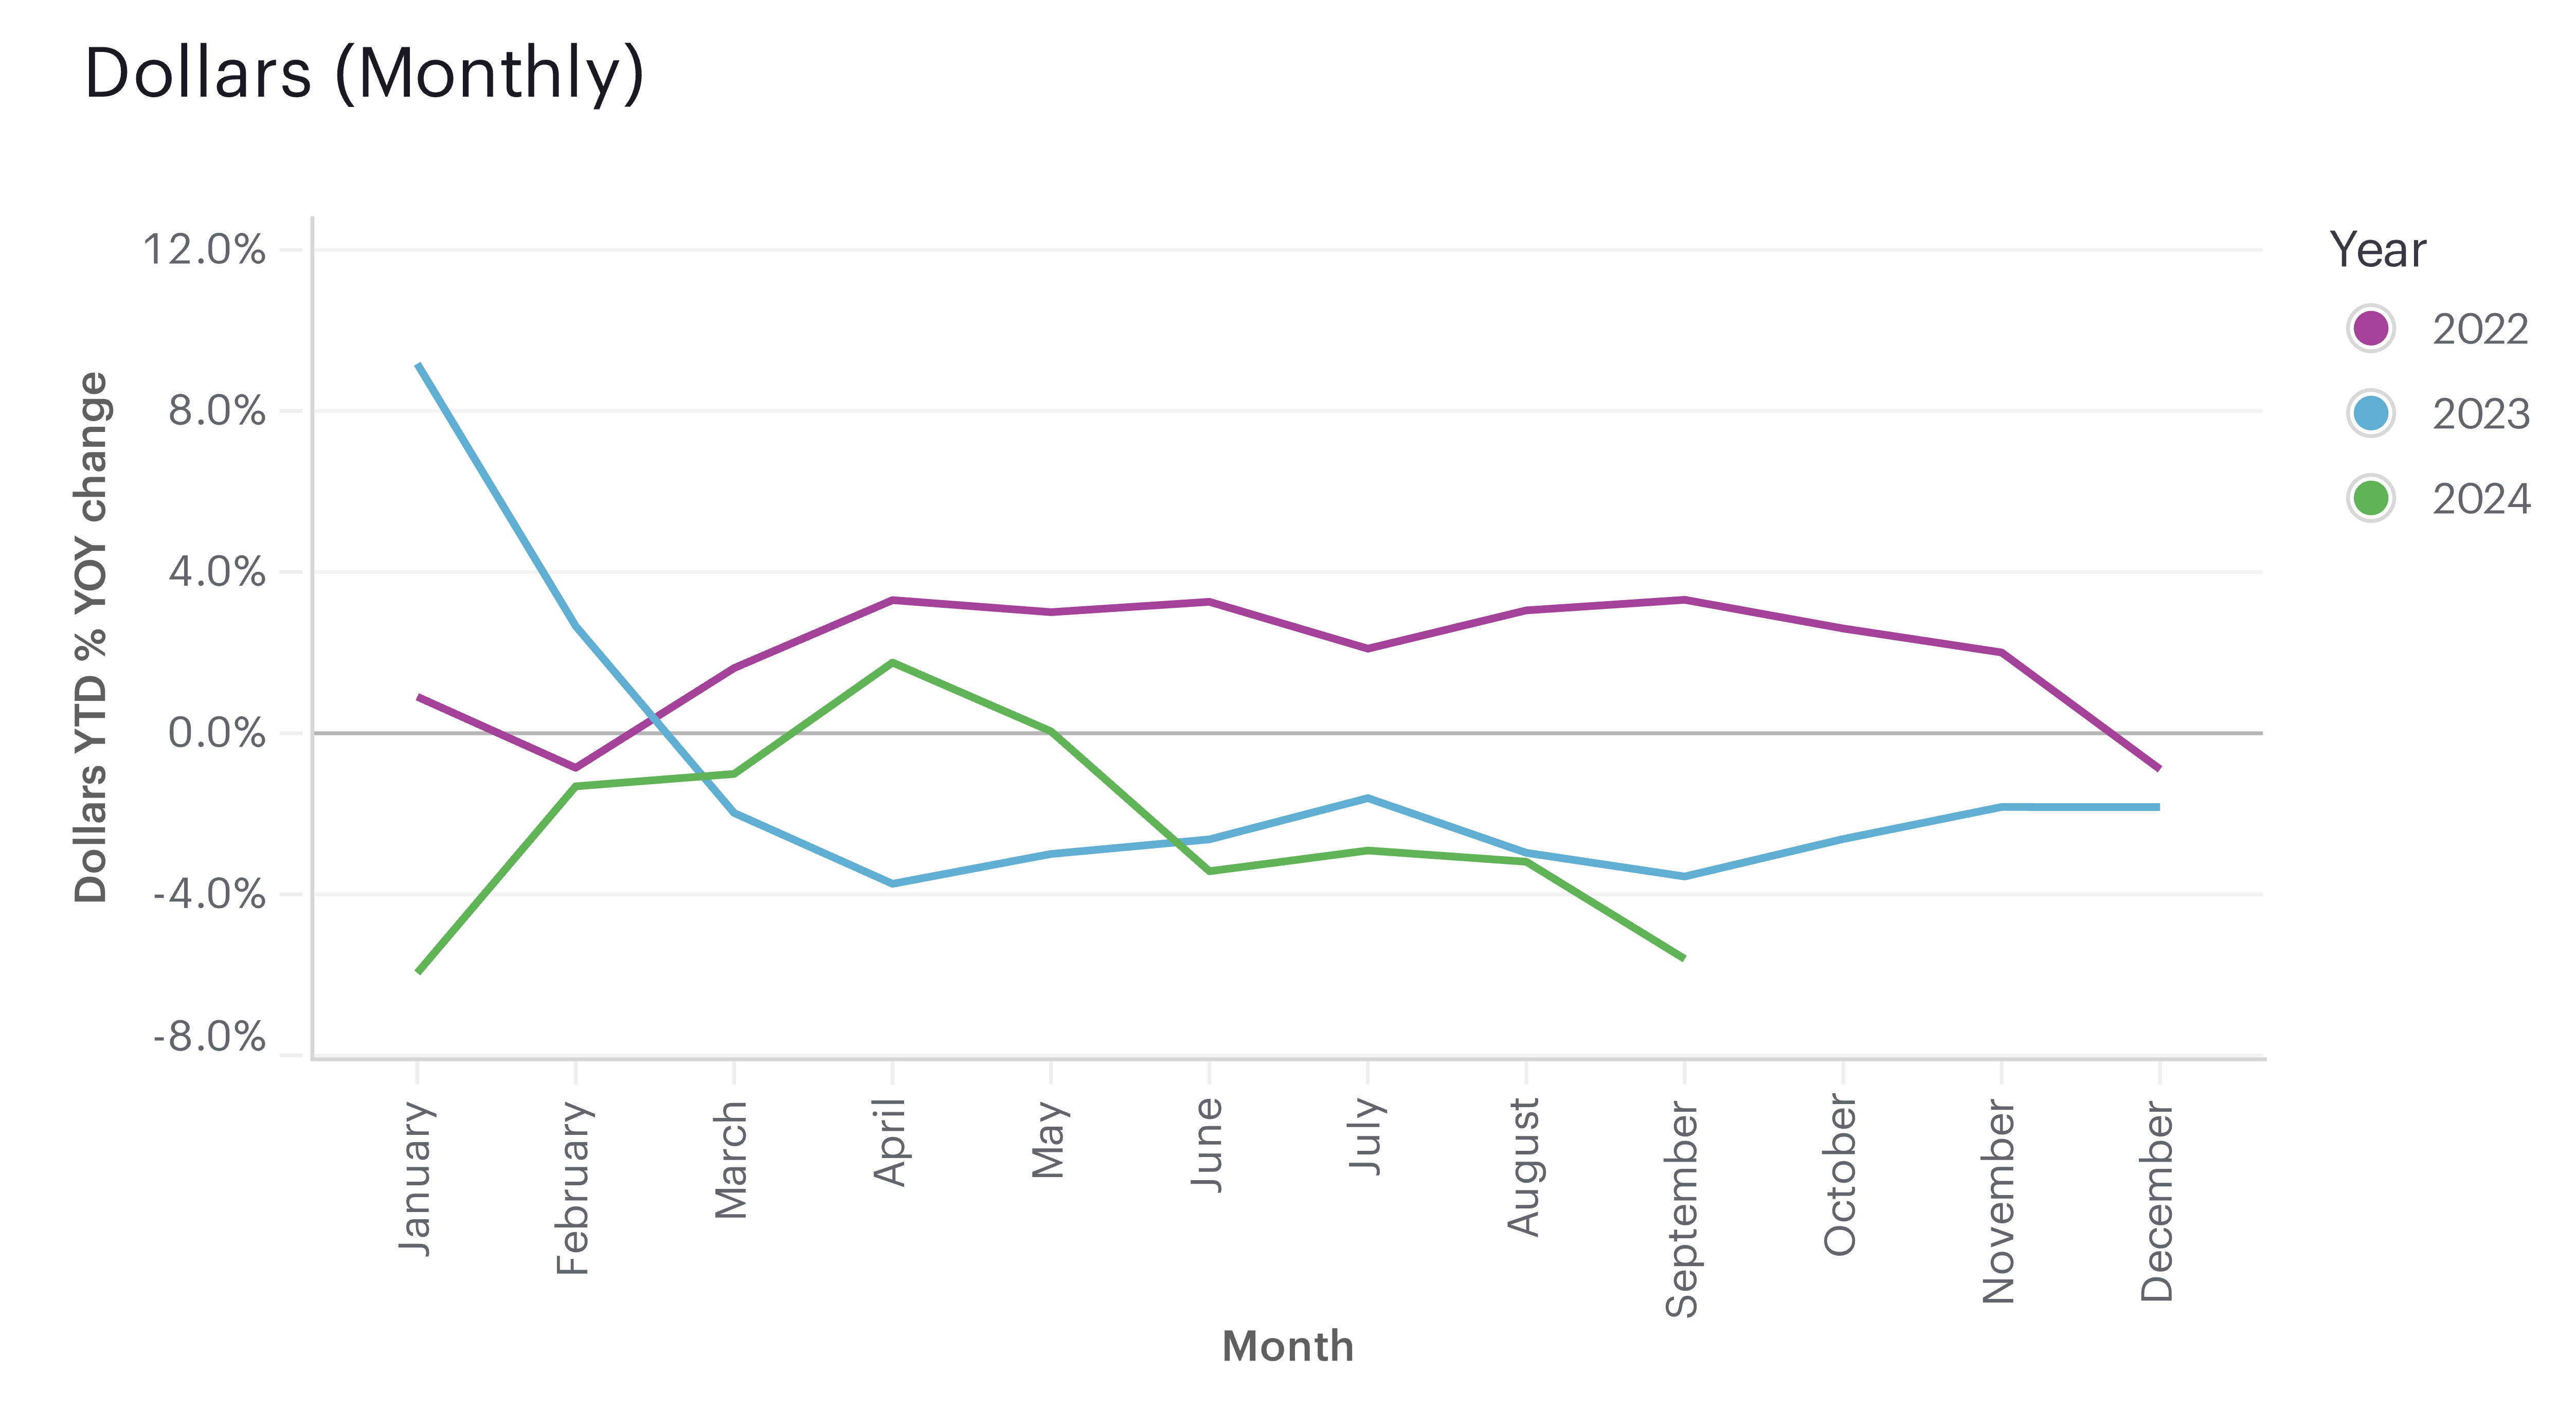
  • We estimate that dollars fundraised have increased by 2.9% (±2.0%) YOY through Q2 2025, after adjusting for late-arriving data.
  • Q2 has been a historically variable quarter in terms of fundraising performance. The past 4 years have fluctuated from moderate increases to slight decreases.


  • This variability in Q2 fundraising outcomes highlights the need to establish consistent giving behaviors and reduce the seasonality of giving.


Year-to-date Fundraising Performance. All rights reserved.
7


Dollars by Donor Size

Year-to-Date Nonprofit Sector Trends
Q2 2025 (JAN 1, 2025 - JUN 30, 2025)

  • Dollars by donor size: the segmentation of dollars based on the size of an individual's total contributions, year-to-date

Key Insights


  • Micro donors, who comprise over half of all donors, contributed 1.9% of total dollars raised
    by the end of Q2 2025. This group experienced the largest decline in dollars (-10.5% YOY, unadjusted
    for late data) relative to the end of Q2 2024. This mirrors a trend we have seen since 2022, in which
    the smallest donors have consistently seen double-digit decreases in total dollars raised in Q1.
  • As highlighted in the Q1 2025 report, supersize donors continue to show comparatively weaker
    performance in dollars raised relative to 2024. Even so, they still accounted for over half of total
    dollars raised year-to-date.

MICRO
($1 - $100)

-10.5%
YOY Change
SMALL
($101 - $500)

-5.7%
YOY Change
MIDSIZE
($501 - $5K)

-4.6%
YOY Change
MAJOR
($5K - $50K)

-3.6%
YOY Change
SUPERSIZE
($50K+)

-7.7%
YOY Change

1.9%
% of total dollars

5.6%
% of total dollars

16.8%
% of total dollars

25.7%
% of total dollars

50.1%
% of total dollars
 
Donor size is computed on a donor’s total year-to-date dollars given.
Year-to-date Fundraising Performance. All rights reserved.
8


Dollars by Life Cycle

Year-to-Date Nonprofit Sector Trends
Q2 2025 (JAN 1, 2025 - JUN 30, 2025)

  • Dollars by donor life cycle: the segmentation of dollars based on when the associated donor was last seen in the dataset, year-to-date

Key Insights


  • Repeat retained donors account for over 60% of all dollars fundraised through Q2 2025, highlighting the outsize role that these consistent donors have in driving fundraising outcomes. Notably, this group experienced the smallest decline in dollars raised of -4.2% YOY, unadjusted for late data.
  • First-time donors represent the second largest group by dollars raised, contributing 17.5% of total dollars donated.
  • This reliance on first-time and established donors suggests an under-explored opportunity: fundraising from mid-stage donors who fall between these groups. Dedicating effort in engaging these groups may help cultivate more consistent fundraising relationships.

NEW
DONORS
 

-8.6%
YOY Change
NEW RETAINED
DONORS
 

-10.5%
YOY Change
REPEAT
RETAINED
DONORS

-4.2%
YOY Change
RECAPTURED
DONORS
 

-8.6%
YOY Change

17.5%
% of total dollars

7.9%
% of total dollars

61.7%
% of total dollars

12.9%
% of total dollars
 
NEW DONORS - never gave to this organization before.
NEW RETAINED DONORS - gave last year to the organization, but never before.
REPEAT RETAINED DONORS - gave last year to the organization, but not for the first time.
RECAPTURED DONORS - did not give last year to the organization, but had given in the past.
Year-to-date Fundraising Performance. All rights reserved.
9


Dollars by Donation Count

Year-to-Date Nonprofit Sector Trends
Q2 2025 (JAN 1, 2025 - JUN 30, 2025)

  • Dollars by donation count: the grouping of dollars based on how many times the associated donor made a donation

Key Insights


  • One-time donors, who represented over two thirds of all donors year-to-date through Q2 2025, contributed just over half of total dollars raised. They experienced the strongest performance in dollars raised relative to other groups.
  • The weakest performance in dollars was observed among donors giving twice (falling 9.6% YOY, unadjusted for late data) and 3-6 times year-to-date (falling 10.8% YOY, unadjusted), compared to Q2 2024.

1 DONATION

-3.4%
YOY Change
2 DONATIONS

-9.6%
YOY Change
3-6 DONATIONS

-10.8%
YOY Change
7+ DONATIONS

-5.2%
YOY Change

52.9%
% of total dollars

16.1%
% of total dollars

19.1%
% of total dollars

11.8%
% of total dollars
 
Donation count segments were selected to best illustrate the distribution of total donors and dollars across the giving spectrum. A donor's donation count includes all donations made year-to-date.
Year-to-date Fundraising Performance. All rights reserved.
10


Retention Rate: Time Series

Year-to-Date Nonprofit Sector Trends
Q2 2025 (JAN 1, 2025 - JUN 30, 2025)

Key Insights


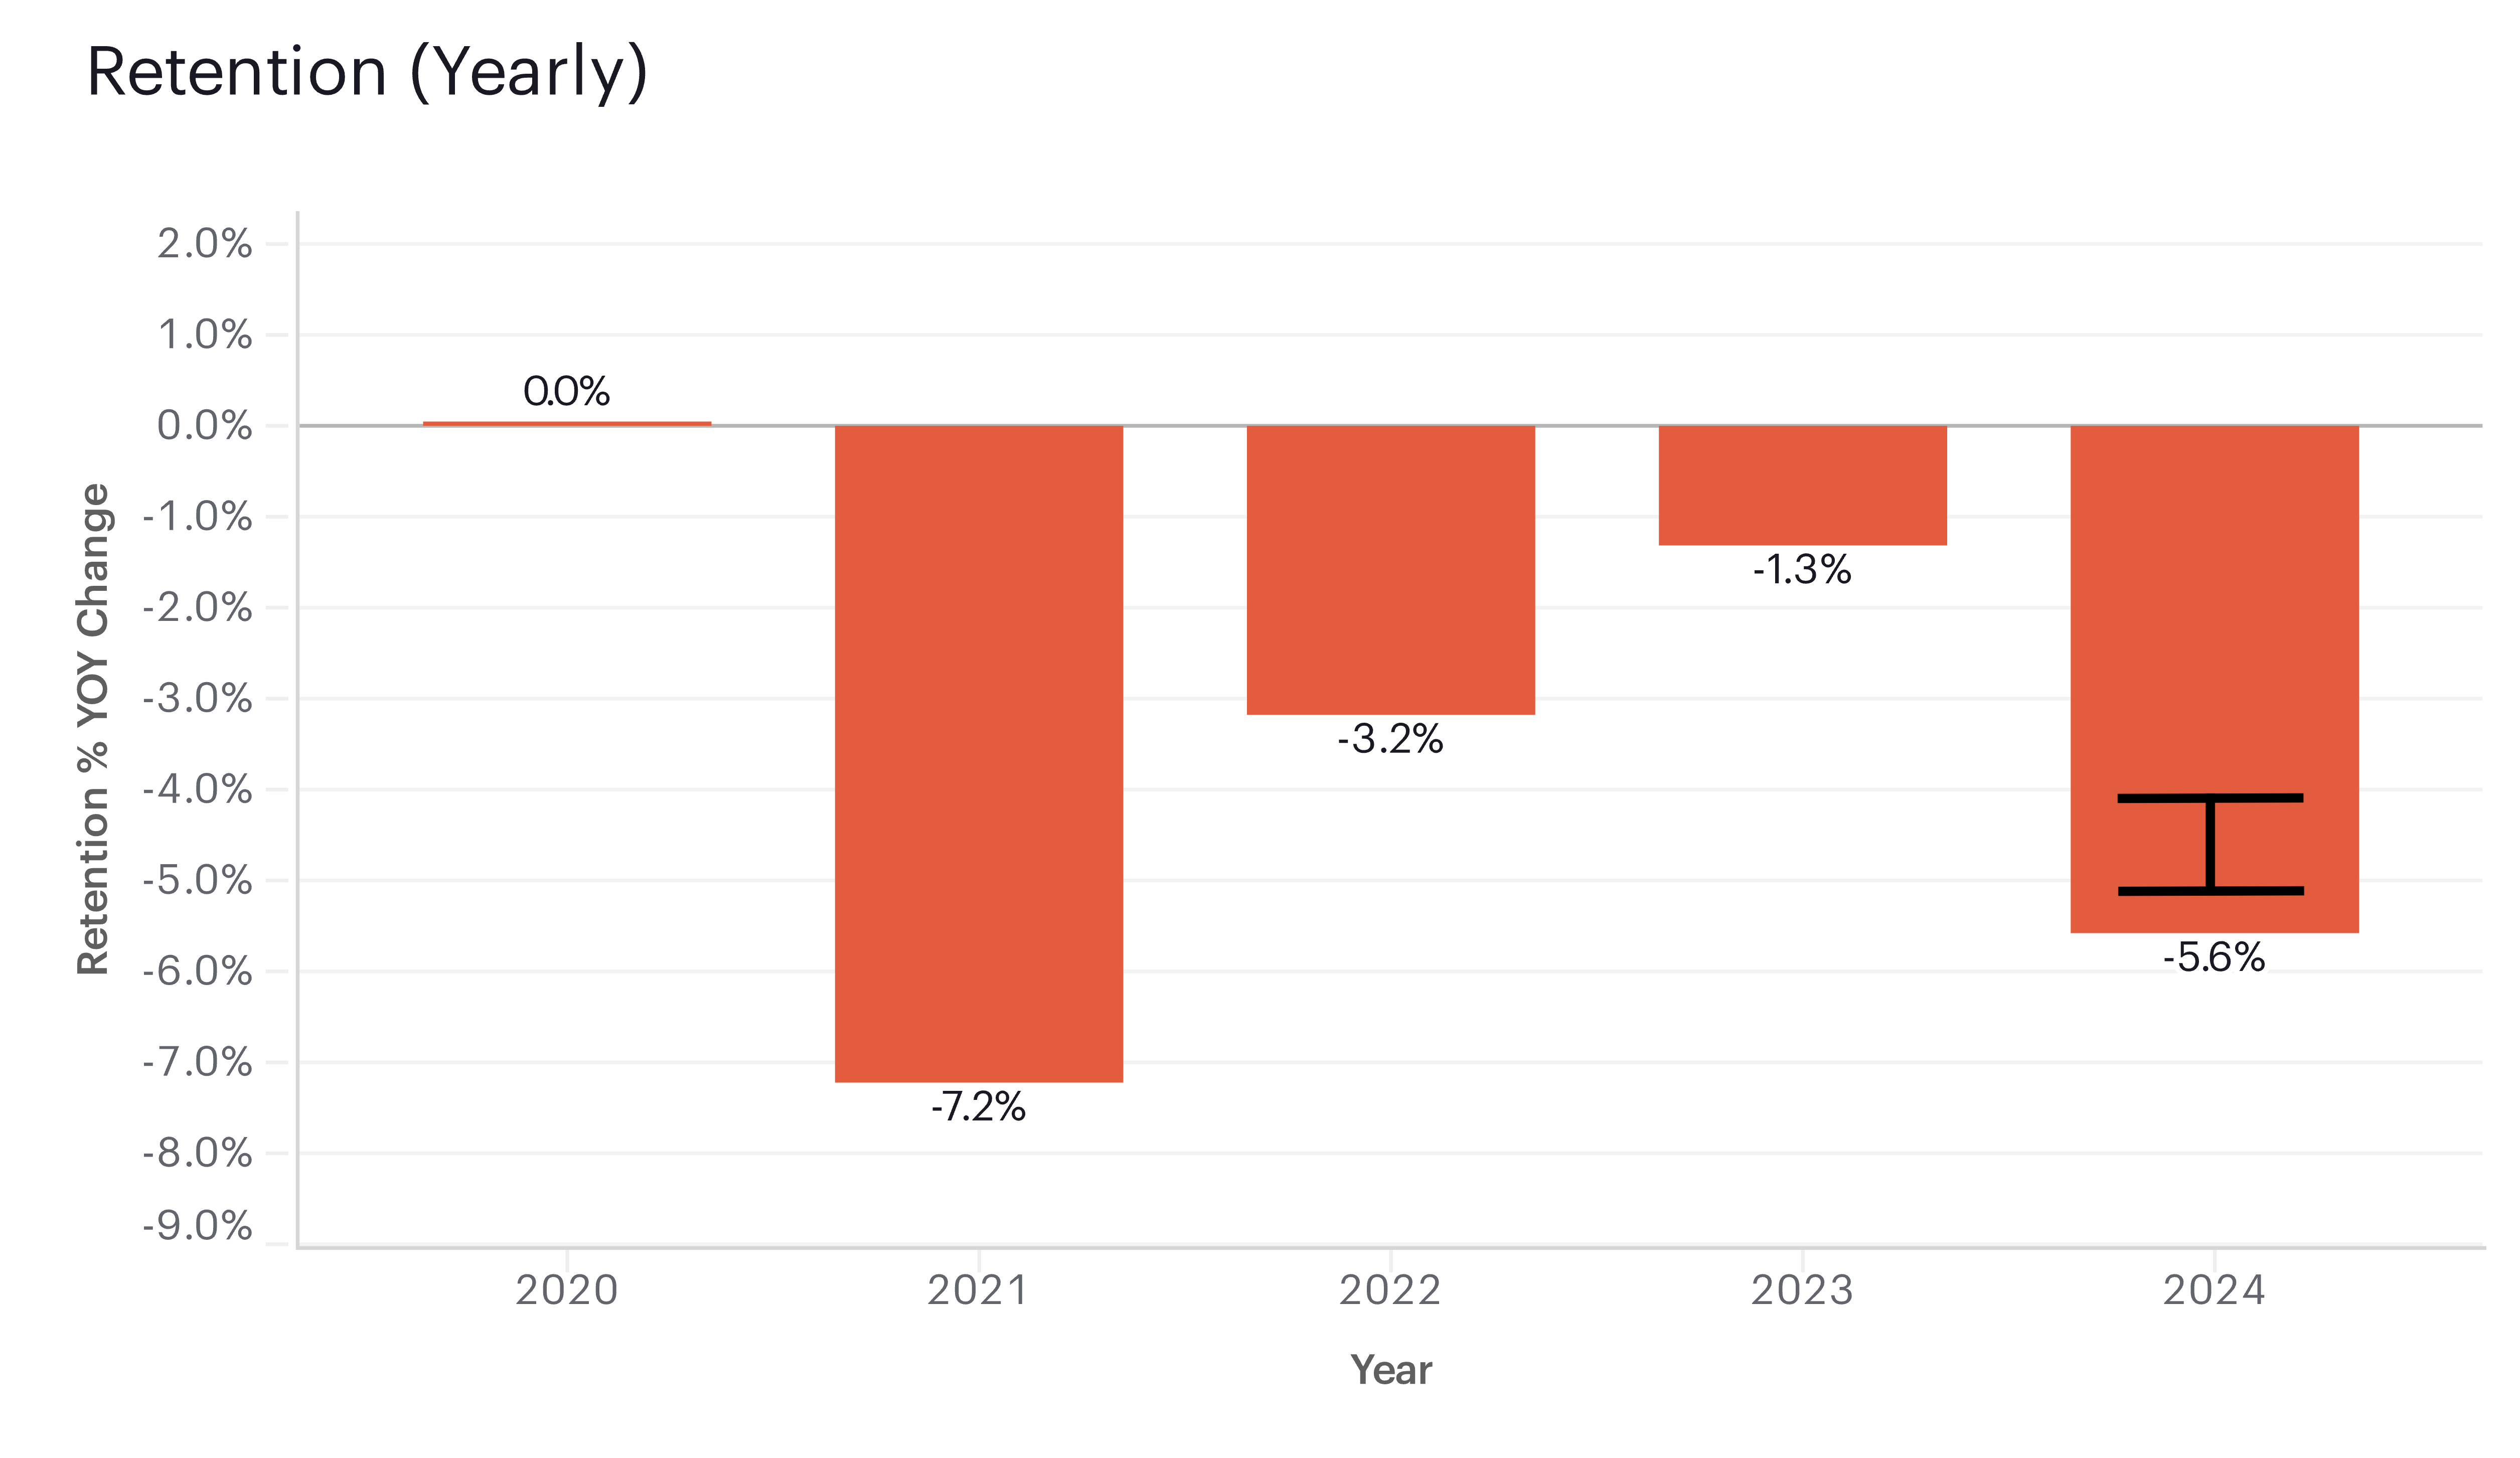
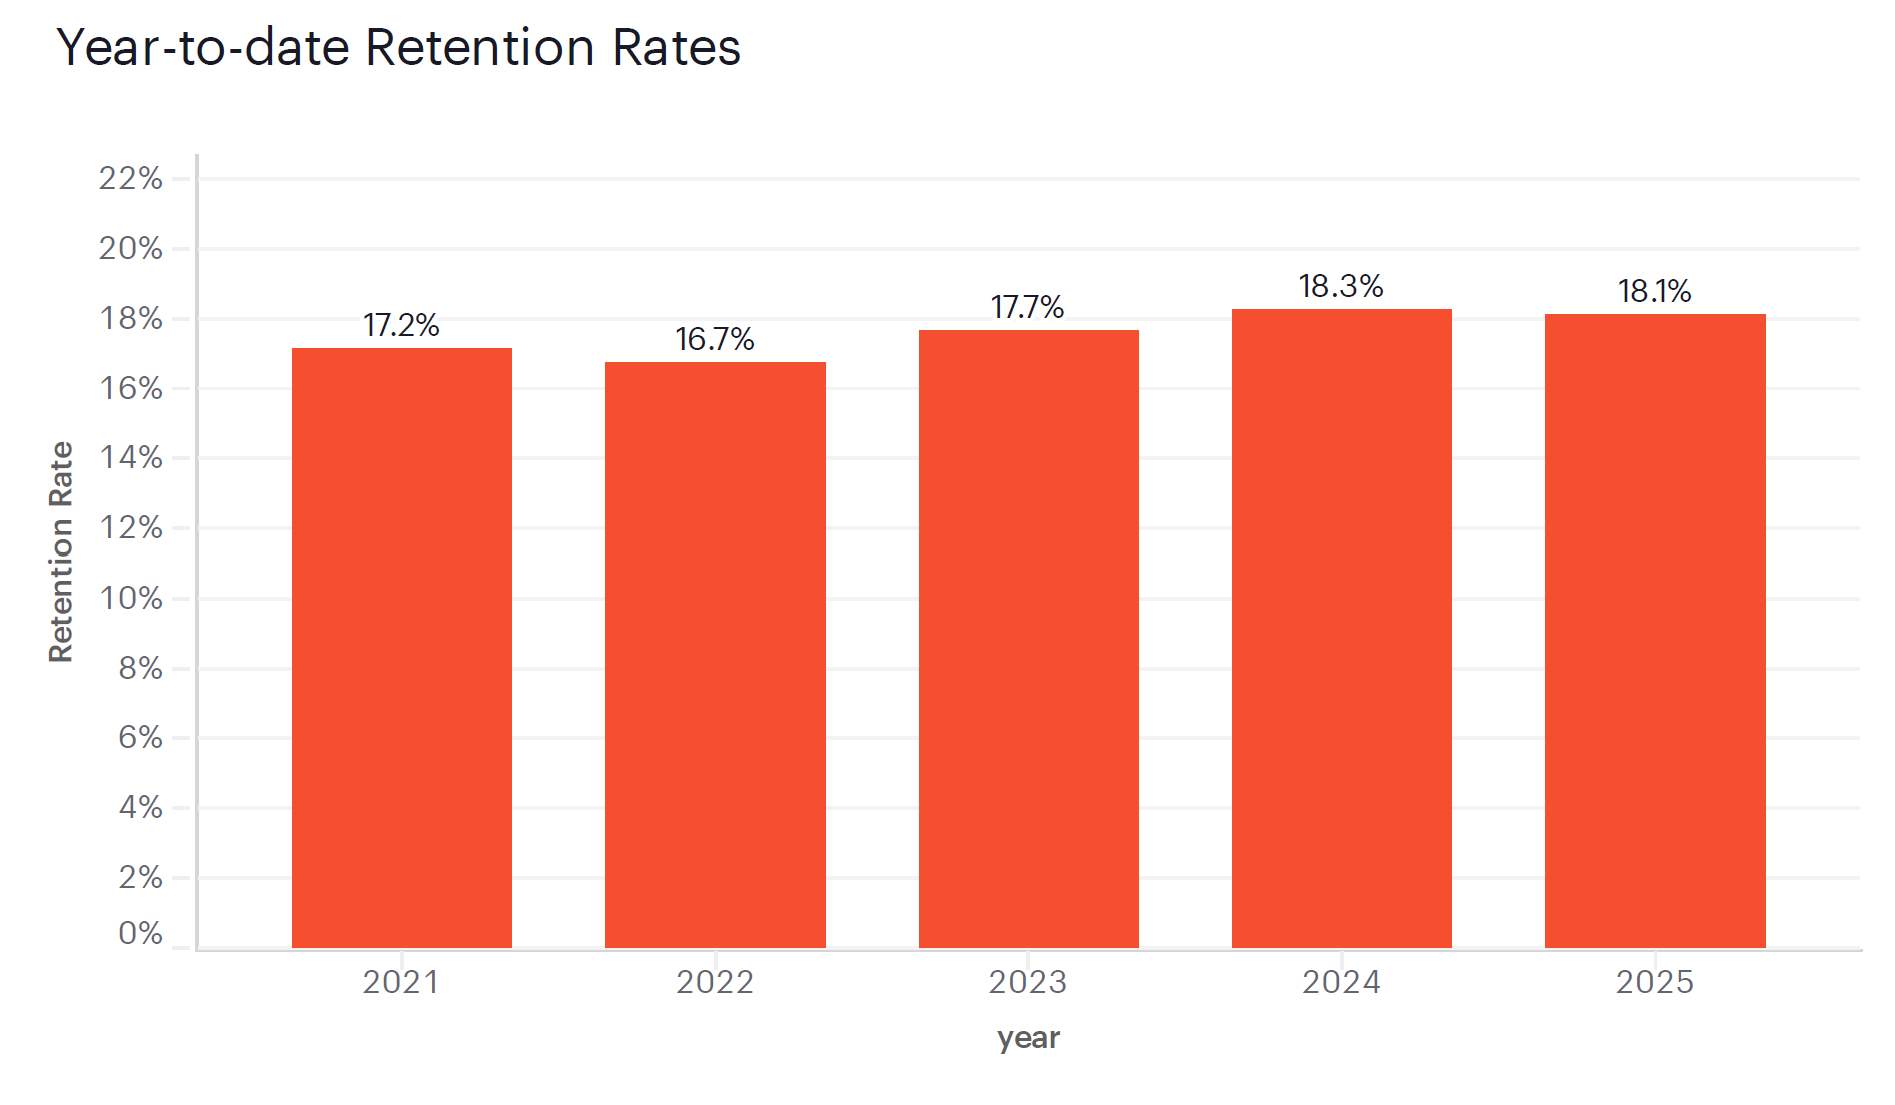
  • After adjusting for late-arriving data, overall donor retention through Q2 2025 slipped by 0.1 percentage points (p.p.). Given the margin of error, the true change could range from a slight increase of 0.03 p.p. to a decline of 0.24 p.p.
  • Although modest, this decline stands in contrast with the retention gains recorded through Q2 over the previous two years.


  • Given this change in retention rates, we estimate that the overall donor retention rate was 26.3%. This figure measures the percent of all donors who gave last year who had given again by the end of Q2.


RETENTION - retention is computed year-to-date. It represents – out of all the people who donated last year – the ratio of people who donated again this year, year-to-date.

As of Q1 2025, we have updated the way we calculate and report year-over-year changes in retention rates. An explanation of the changes can be found here.
Year-to-date Fundraising Performance. All rights reserved.
11


Retention Rate: Donor Type

Year-to-Date Nonprofit Sector Trends
Q2 2025 (JAN 1, 2025 - JUN 30, 2025)

Key Insights


  • Year-to-date, 11.0% of donors newly acquired in 2024 have been retained (unadjusted for late data), holding steady compared to new donor retention rate in the same period in 2024.
  • Retention among repeat donors is higher, with 36.3% (unadjusted) retained so far this year, a rate that has fallen slightly by 0.1 p.p. compared to the first two quarters of 2024.
  • The recapture rate has declined slightly to 1.4% (unadjusted), down 0.1 p.p. from the first half of 2024.

NEW DONOR
RETENTION RATE

-0.0 p.p.
YOY Change
REPEAT DONOR
RETENTION RATE

-0.1 p.p.
YOY Change
RECAPTURE
RATE

-0.1 p.p.
YOY Change

11.0%
retained YTD

36.3%
retained YTD

1.4%
recaptured YTD
 
NEW DONORS - never gave to this organization before.
REPEAT DONORS - donors who gave last year to the organization, and were not new last year.
RECAPTURED DONORS - donors who did not give last year to the organization, but had given in the past.
Year-to-date Fundraising Performance. All rights reserved.
12


Retention Rate by Donor Size

Year-to-Date Nonprofit Sector Trends
Q2 2025 (JAN 1, 2025 - JUN 30, 2025)

Key Insights


  • Organizations saw the largest decline in retention among donors who gave between $5K and $50K
    last year (unadjusted for late data). However, at over 40% this segment still has the second-highest
    retention rate so far in 2025.
  • Prioritizing donors in the latter segment may help bolster fundraising outcomes at the mid-year point.
  • Micro donors had the lowest retention rate at just 16.8% year-to-date (unadjusted for late data).
    Although this segment of donors contributed less than 2% of total dollars raised, they account for half
    of all donors. Nonprofits neglecting this group risk significant long-term erosion of the donor base.

MICRO
($1 - $100)

-0.7 p.p.
YOY Change
SMALL
($101 - $500)

-0.8 p.p.
YOY Change
MIDSIZE
($501 - $5K)

-0.9 p.p.
YOY Change
MAJOR
($5K - $50K)

-1.3 p.p.
YOY Change
SUPERSIZE
($50K+)

-0.8 p.p.
YOY Change

16.5%
retained YTD

31.7%
retained YTD

42.0%
retained YTD

42.7%
retained YTD

47.0%
retained YTD
 
Donor size segments were chosen to span both dollars and donors, with each segment representing 1-50% of the total.
Year-to-date Fundraising Performance. All rights reserved.
13


Retention Rate by Donation Count

Year-to-Date Nonprofit Sector Trends
Q2 2025 (JAN 1, 2025 - JUN 30, 2025)

Key Insights


  • Donors who gave more frequently in 2024 have been retained at higher rates by the end of Q2 2025.
  • The largest decline in retention was observed in donors who gave twice or 3-6 times in 2024, falling 1.5 and 1.4 p.p. (YOY, unadjusted for late data), respectively, through Q2 as compared to the same period in 2024.

1 DONATION

-0.5 p.p.
YOY Change
2 DONATIONS

-1.5 p.p.
YOY Change
3-6 DONATIONS

-1.4 p.p.
YOY Change
7+ DONATIONS

+0.8 p.p.
YOY Change

13.9%
retained YTD

30.0%
retained YTD

55.3%
retained YTD

86.2%
retained YTD
 
Donation count segments were selected to best illustrate the distribution of total donors and dollars across the giving spectrum. A donor's donation count includes all donations made year-to-date.
Year-to-date Fundraising Performance. All rights reserved.
14


Organization Size Impact: Splits

Year-to-Date Nonprofit Sector Trends
Q2 2025 (JAN 1, 2025 - JUN 30, 2025)

Key Insights


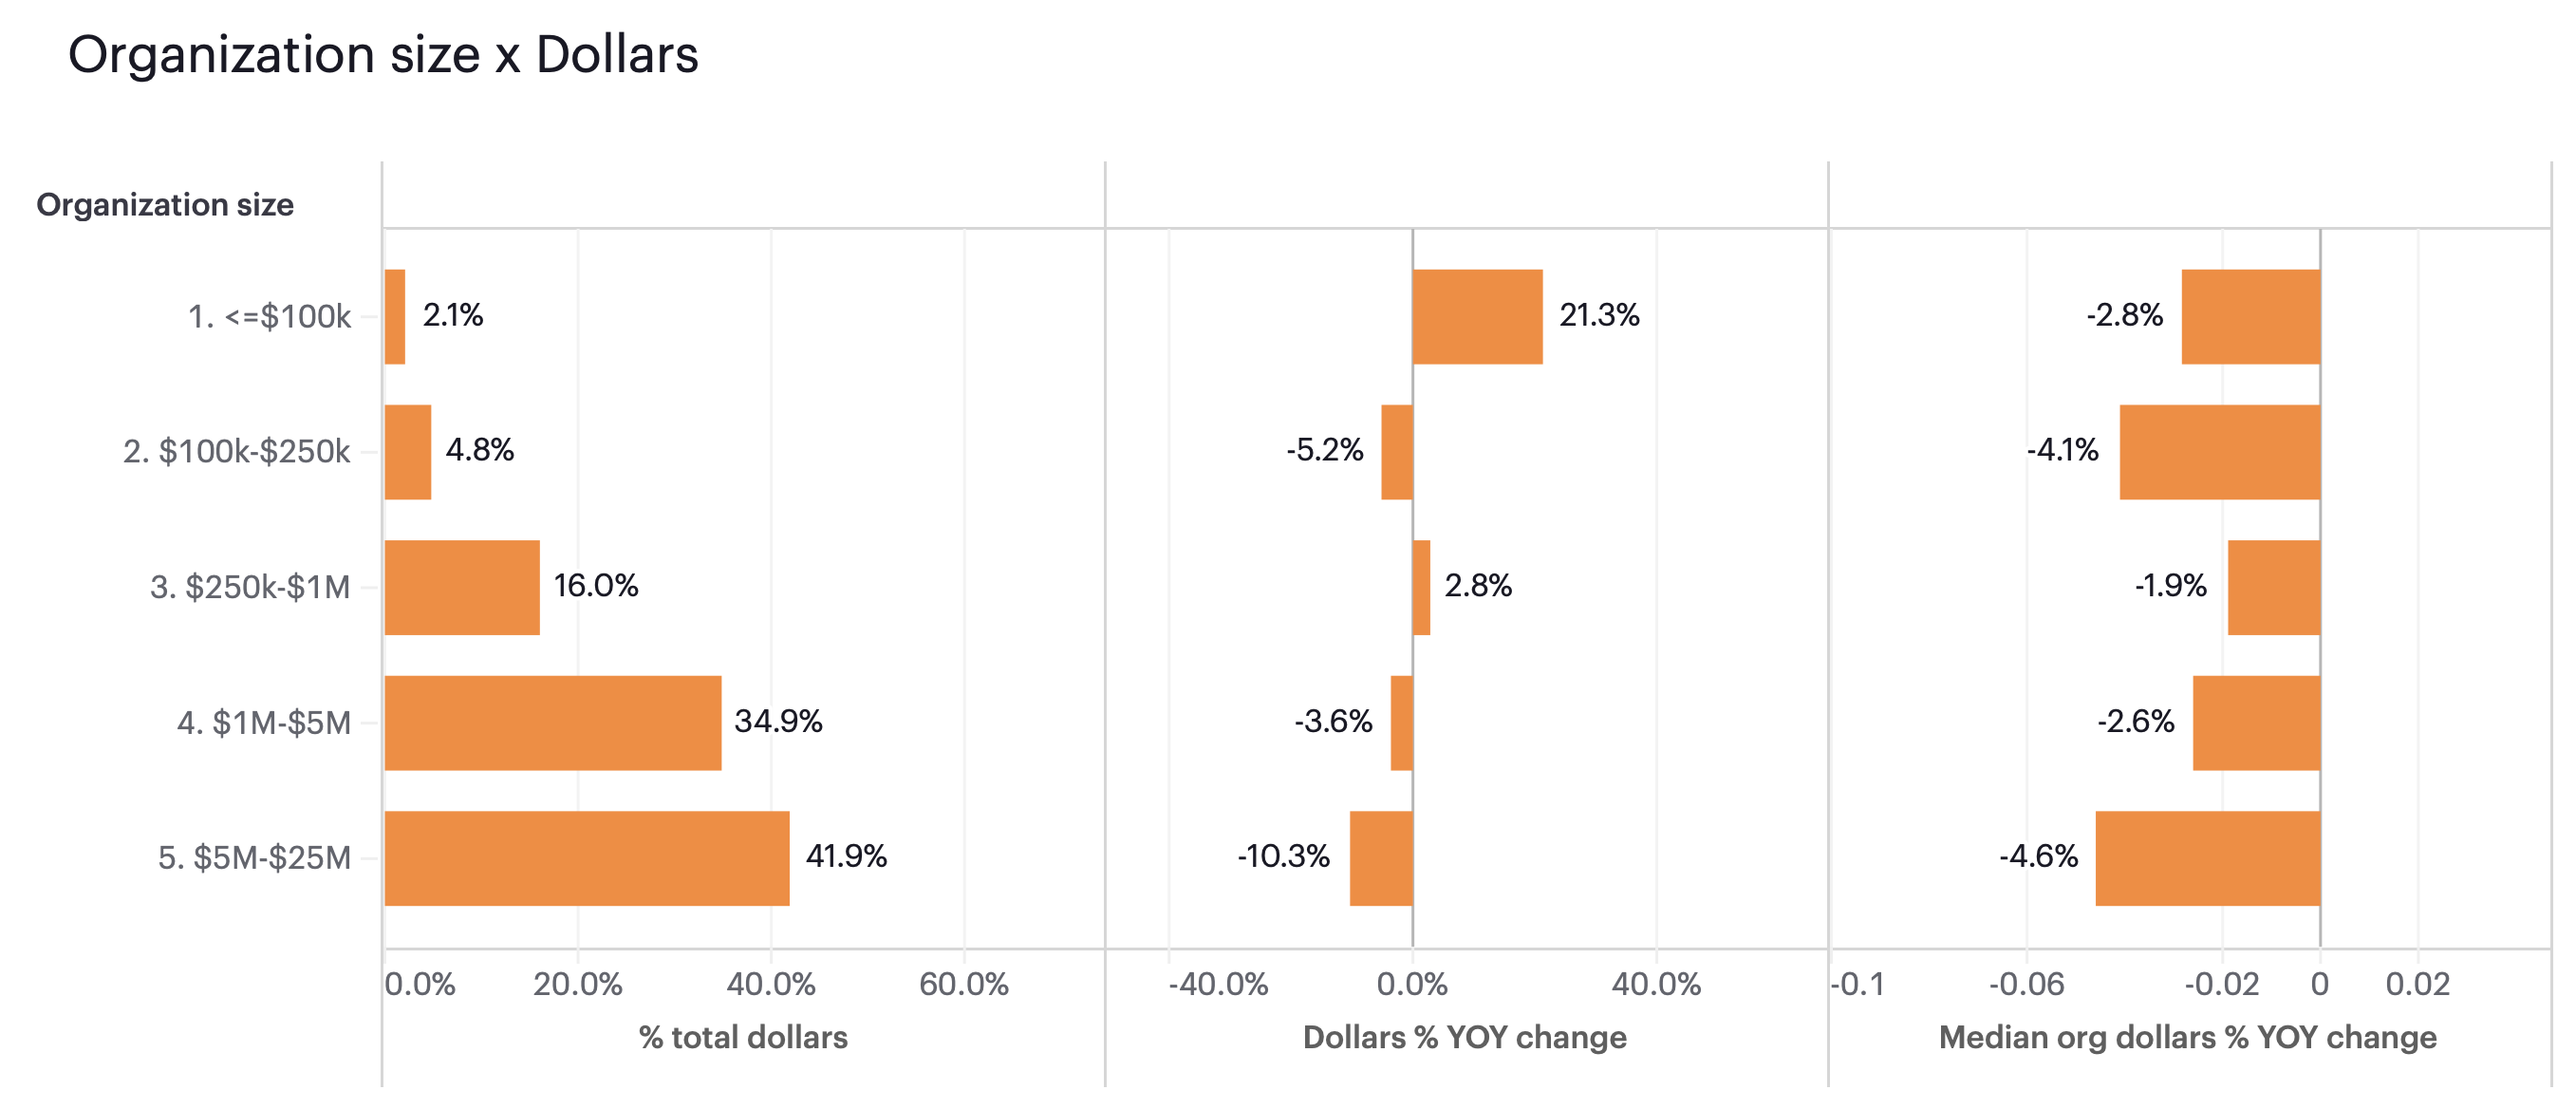
  • The largest organizations (with fundraising between $5M and $25M) experienced the sharpest decrease in dollars raised, at -12.2% (YOY, unadjusted for late data).
  • Organizations in the smallest two fundraising categories both saw more than a 4% increase (YOY, unadjusted) in dollars raised.
  • However, this effect is skewed by a handful of organizations who had an exceptionally successful fundraising performance; the median indicates that at least 50% of organizations within these categories saw fundraising dollars decrease.

 
% DOLLAR GROWTH (MEAN) - year-over-year dollar growth for organizations, grouped by an organization's budget size. Trends in the mean are more informative of the sector as a whole.

% DOLLAR GROWTH (MEDIAN) - the median year-over-year dollar growth for organizations, grouped by an organization's budget size. Trends in the median are more indicative of a typical organization's fundraising experience.
Year-to-date Fundraising Performance. All rights reserved.
15


Organization Cause: Split

Year-to-Date Nonprofit Sector Trends
Q2 2025 (JAN 1, 2025 - JUN 30, 2025)

Key Insights


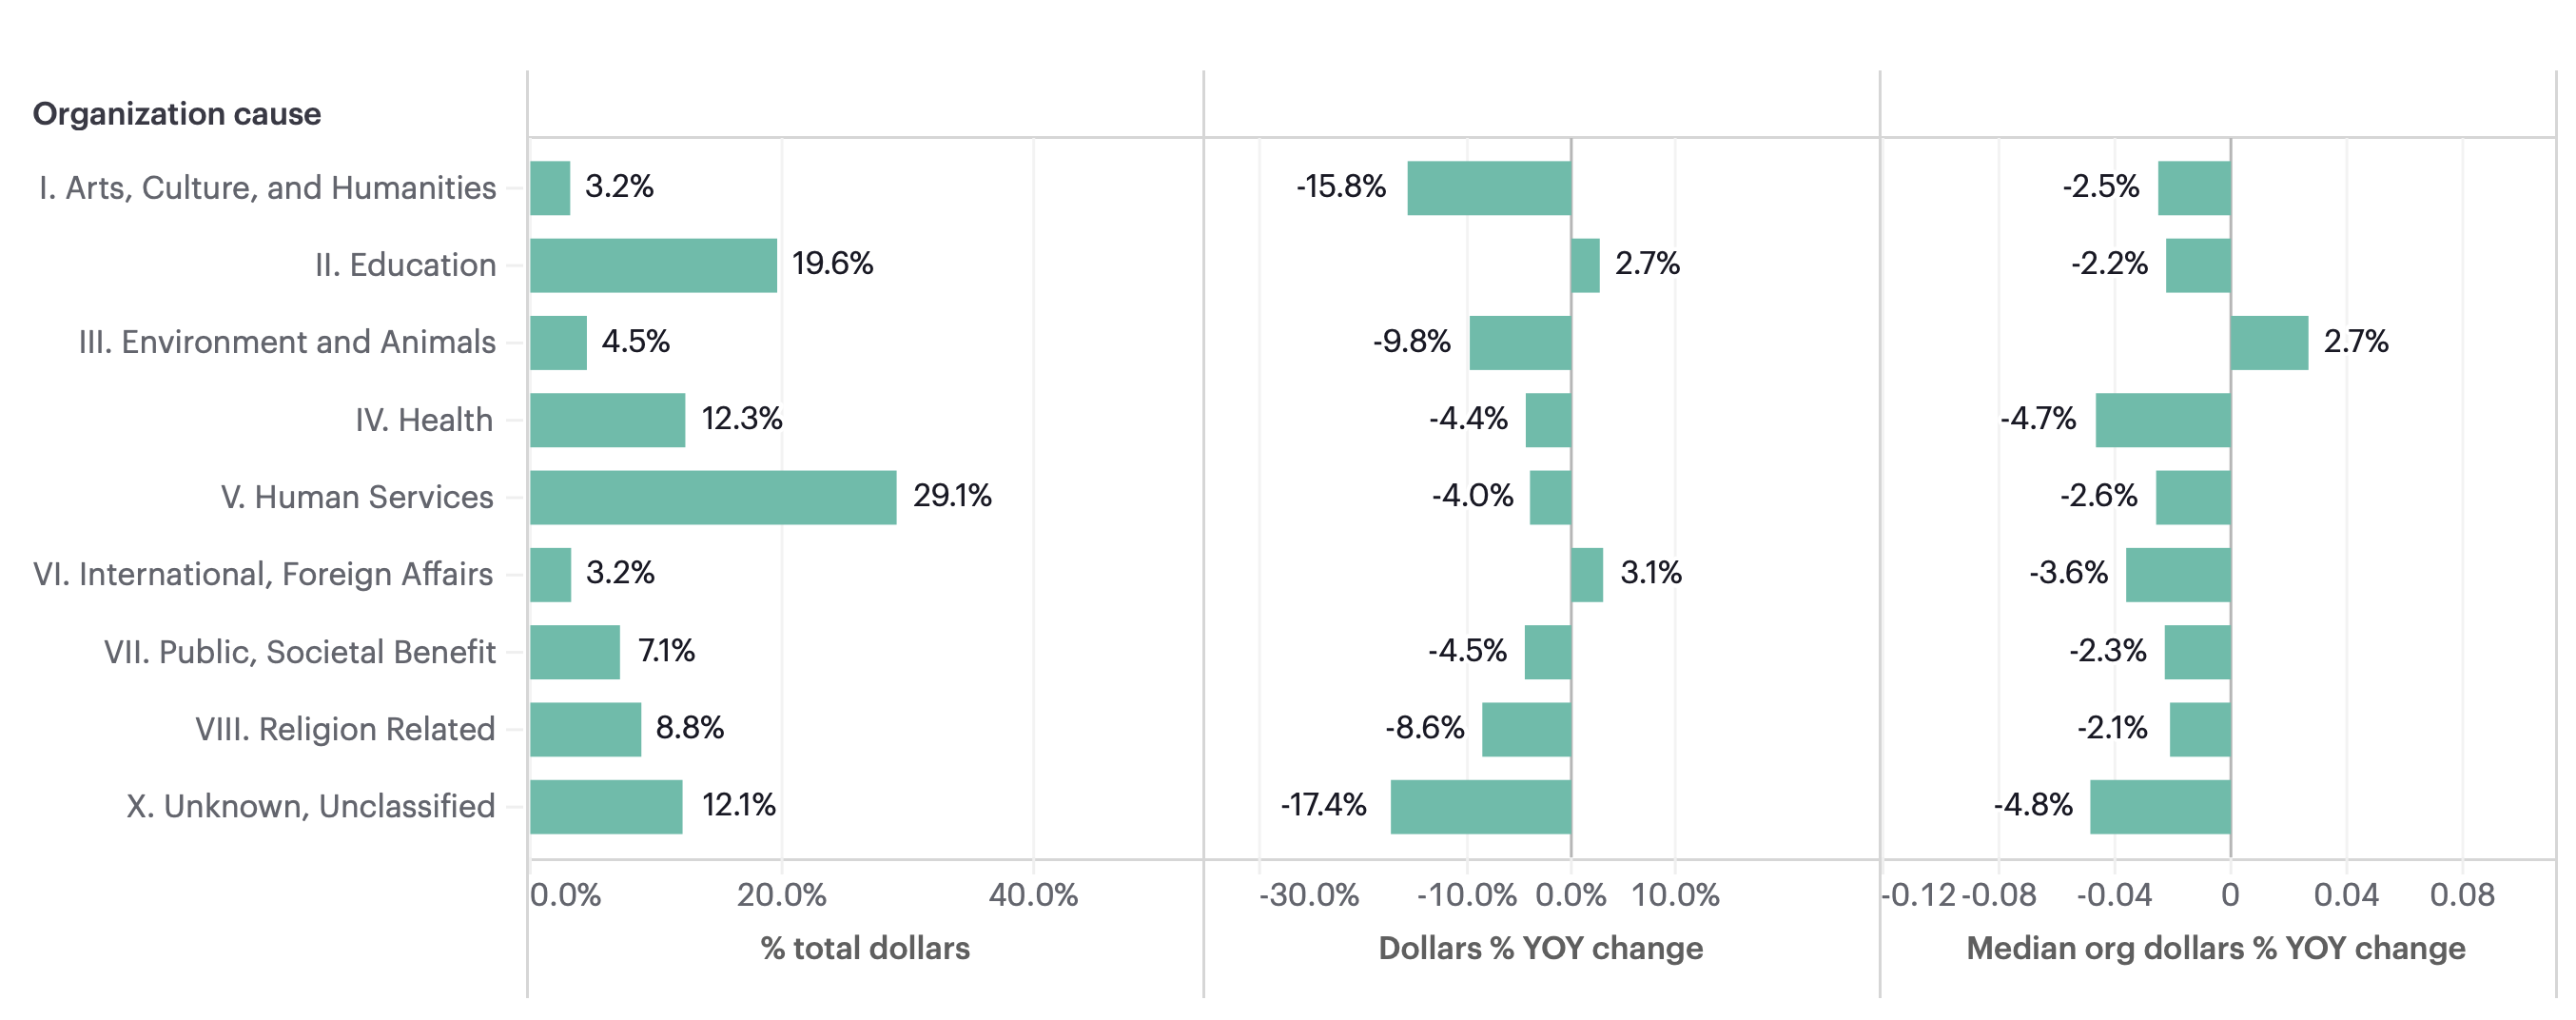
  • 'Environment and Animals' organizations exhibited the strongest dollar growth, both in aggregate and for the typical (median) organization.
  • Without adjusting for late data, all other sectors exhibited a year-on-year decline in dollars through Q2 2025 as compared to the same period in 2024.

 
% DOLLAR GROWTH (MEAN) - year-over-year dollar growth for all organizations of this NTEE major group. More informative about the sector as a whole.

% DOLLAR GROWTH (MEDIAN) - the median year-over-year dollar growth across each organization of this NTEE major group. More indicative of a typical organization's fundraising experience.
Year-to-date Fundraising Performance. All rights reserved.
16

FUNDRAISING EFFECTIVENESS PROJECT


The Fundraising Effectiveness Project (FEP) delivers trusted data insights that help fundraisers improve their outcomes, driving growth and increasing generosity across the nonprofit sector. We envision a sector where actionable data guides every fundraiser’s decisions, helping nonprofits become more effective and adaptive. Since its founding in 2006, FEP has become a leading resource for data-driven insights. FEP is a collaborative project of the Association of Fundraising Professionals (AFP) Foundation for Philanthropy and GivingTuesday.


METHODOLOGY


We removed organizations that did not have a minimum of 25 donations and $5,000 in revenue in each of the previous three years. We removed organizations at either tail of the revenue growth curve. If revenue growth was more than 300% or less than -66% in any of the past three years, organizations were removed. We also excluded individual contributions above $10M. We weighted our data by organization size and NTEE major group to make it reflective of 2018 IRS filers in the $5K - $25M range of contributions. Details regarding estimation methodology for late reported data can be found here.


ORGANIZING SPONSORS
 
DATA PROVIDERS
The FEP wouldn't be possible without data. These software providers make the collection of data in support of the project possible.
 

Year-to-date Fundraising Performance. All rights reserved.
17